Series 3, Year 30
Upload deadline: Upload deadline: 10th January 2017 11:59:59 PM, CET
(3 points)1. long film
You are downloading your favourite film with file size 12 GB at 10 MB ⁄ s. Assuming the signal travels along a twisted-pair wire at the speed of light and modulation spreads the transmission speed evenly, that is at 1 b ⁄ s we would have to receive 1 second of the signal to acquire 1 bit of information, determine the length of cable filled by the film's data if it travels along a sufficiently long cable.
Michal's colleague claimed that 100Gb Ethernet frames are smaller than a chip.
(3 points)2. hellish
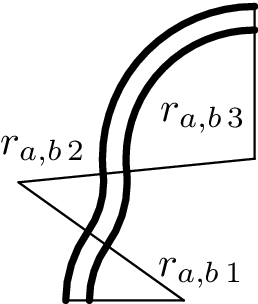
A road and a pathway, both leading to Hell, lie on different sides of a river. We are moving along the river in the direction shown in the picture. Banks of the river are formed by concentric circular arcs. The pathway leads along one bank, the road along the other and the width of the river is constant. Route along which bank of the river is faster? For every arc, we know the central angle $φ_{1},φ_{2},\ldots$ and the radius $r_{a1},r_{b1},r_{a2},r_{b2},\ldots$, where the suffices $a,b$ denote the left and right bank respectively.
Occurred to Lukas on the way to Peklo (Hell).
(7 points)3. where's the whistle
Verca's ears can be aproximated by two point detectors separated by distance $d$, which can detect incoming sound waves equally well from all directions. Verca can determine the location of a known source extremely well and so, one day, just as she woke up, she asked her friends to test her. However, Verca forgot an earplug in one ear, reducing the intensity in her left ear $ktimes$. Verca was blindfolded and a source was placed at a position $y$ in front of her and $x$ to her right (or $-x$ to her left). Determine the position ( $x′,y′)$ Verca will point to if she determines the position of the source using the intensity of the sound.
Lubosek got frightened by a phone while wearing a single headphone.
(7 points)4. free radar
A red marker is placed on every bollard along a road (wavelength of the red colour used is $λ_{r}=630nm)$. When the driver of a passing car sees the marker as blue (wavelength $λ_{b}=450nm)$, she knows that she is speeding. What is the car's speed when this happens? What is the momentum and kinetic energy of a typical passenger car at this speed?
Kuba found a futuristic-looking photo on the internet.
(7 points)5. pulleying
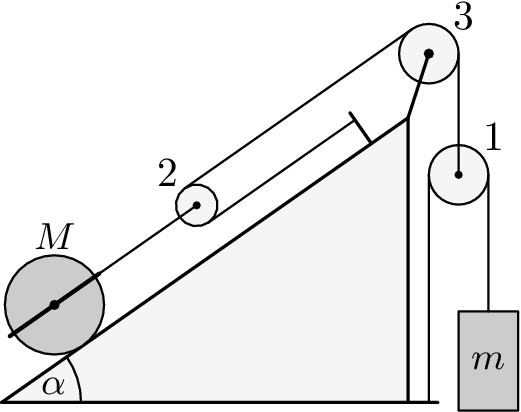
Consider the pulley system in the picture. If the masses $m_{i}$, radii $R_{i}$, and moments of inertia $J_{i}$ for all pulleys, mass $m$ of the weight, and mass $M$, radius $R$, and moment of inertia $J$ of the cylinder are all known, we neglect the weight of pulley 2 and thus consider the ropes leading to pulley 2 as parallel with the inclined plane, the coefficient of friction (both static and kinetic) between the cylinder and the surface is $f$ and the rope does not slip on the pulleys, determine the acceleration (optionally the angular acceleration as well) of the weight $m$ and the cylinder $M$.
Kuba found the example class unnecessarily easy.
(8 points)P. openhearted
Estimate the work performed by the heart pumping blood in one day. What can you compare this energy to? What percentage of the recommended daily energy intake is your estimate?
Karel's heart started pounding.
(12 points)E. reflective snap band
Measure as many characteristics of a high-vis snap band as you can. We are specifically interested in:
- The band contains a piece of metal on the inside, which can be bent lengthwise (when coiled) or along the shorter edge (when straight). What are the radii of curvature of these bents if there is no external force?
- If the band is straight and we start bending it in one place, at what angle will it snap into the bent state? At what angle does it become straight again? (Do we see any hysteresis?)
- What is the torque required to bend the band?
- Is one of the states (bent or straight) more energetically favourable? Estimate by how much. Unfortunatelly, we are unable to mail these bands abroad, we therefore ask that you obtain one yourself and include pictures of the band you used in your solution.
Erik could not bend his …
(10 points)S. limiting
- Try to, in your own words, describe the method for creating interval estimations of expected value of a general distribution of measured data (it is sufficient to describe the following: central limit theorem (CLT), covariance, correlation (Pearson correlation coefficient), multidimensional CLT, law of propagation of uncertainty and its uses.) It’s not necessary to describe the concepts mathematically, a brief description in your own words is sufficient.
- In the attached datafile mereni3-1.csv there are measurements of a certain physical quantity $v$. Assume we cannot be sure whether the measured data have a normal distribution. Find the uncertainty (standard deviation) of the measurements (neglect the type B uncertainty), set up the interval estimations using CLT and briefly interpret their meaning. How would the results (and interpretation) change if only the first quarter of the data was available?
- Suppose our aim is to measure a physical quantities $x$ and $y$, which we will then plug into the equation \[\begin{equation*} v= \frac {1}{2} x y^2 . \end {equation*}\] and suppose that we are certain that all measurements are independent and we already have measured a significant amount of data, processed them and there are the results \[\begin{align*} x &= (5,2\pm 0.1) , \\ y &= (12{,}84\pm 0.06) . \end {align*}\] Estimate the value of $v$ and its uncertainty.
Hint: These equations may come in handy $$\frac{\partial}{\partial x} \( \frac {1}{2} x y^2 \) = \frac {1}{2} y^2\, ,$$ $$\frac{\partial}{\partial y} \( \frac {1}{2} x y^2 \) = x y \, .$$ - Using a computer simulation demonstrate the validity of central limit theorem i.e. generate $n$-tuples (sequences of $n$ real numbers) of independent realizations of a random variable, which does not have a normal distribution (use the exponential, uniform and Poisson distributions with arbitrary parameters) and show, using a histogram, that applying the transformation \[\begin{equation*} \sqrt {n}\frac {\overline {x_n - \mu }}{S_n} , \end {equation*}\] to the data will (approximately) yield a normal distribution $N(0, 1)$.
Bonus: Suppose our aim is to measure physical quantities $x$ and $y$, which we will then plug into \[\begin{equation*} v= x^2 \sin y . \end {equation*}\] Assume the most general model of measurement (i.e. the measured data do not have a normal distribution and the measurements of $x$ and $y$ may not be independent. In the datafile mereni3-2.csv you may find the results of measurements of $x$ and $y$, determine the uncertainty of $v$ and construct an interval estimation of $v$.
For data processing and creating of plots use the R programming language. In the attached scripts is explained all necessary syntax.